5 tips for better room acoustic measurements
The technical quality is not very important for the first measurements of your room. The insights you get from the new diagrams such as the impulse response and the waterfall diagram or spectogram are very interesting and informative in any case!
In this respect, every measurement is better than no measurement! In my blog article on measuring room modes, I briefly outlined the first steps and settings with REW (Room EQ Wizard) so that you can take a first measurement of your own room as easily as possible - in case you haven’t done any such measurements yet.
As soon as the measurement setup is complete and you have taken your first measurements, the quality can easily be improved with a few simple tricks.
The most important parameter is the signal-to-noise ratio. Many room acoustic properties such as the reverberation time consider the level to drop by 60dB. And of course this can only be clearly shown if our measurement data also have such a dynamic range.
The following comparison of a spectogram and the associated impulse response illustrates the difference between a technically bad (left) and a good (right) measurement:


We are particularly interested in the frequency-dependent decay behavior in the bass range. It is important to recognize where room modes reverberate and where they should be treated acoustically. If the background noise is too high, we can only recognize tendencies, but find it difficult to make a clear decision about the next steps.
Both spectograms show a 60dB decay. In the example on the left, at -60dB the limit of the noise floor is already reached and the contours of the room modes are not clearly recognizable.
In the example on the right, we see from the impulse response that the background noise only begins below -80dB compared to the peak. The 60dB decay is clearly defined in the spectogram.
If good measurement data are not available, a level drop of only 30dB or 40dB can of course be analysed and the contours become sharp again. But occasionally you may want to hit the full 60dB. And that's not that difficult!
The test setup
For the example diagrams, I put the measurement signal on my left speaker and set the microphone to my normal listening position. Since the outside noise changes constantly, I have created my own background noise. There was a constant pink noise on the right speaker all the time.

I also lowered the measurement signal significantly for most measurements. While I would normally measure at -20dB or -25dB (which would result in about 80-85dB SPL with my active speakers), I deliberately worsened it at -50dB today. The measurement signal is barely audible, but is almost lost in the background noise.
So what to do if the acoustic situation is not optimal, but we still want to take good measurements? Here are a few suggestions:
1. Increase the volume of the measurement signal
I think it's self-explanatory that we should turn up our measurement signal to some extent when it comes to measuring room acoustic parameters. Because this is the simplest and most important point and is therefore at the top of the list!
This is not very relevant for the frequency response of a loudspeaker and the measurement of the EQ, because we usually focus on direct sound.
If, on the other hand, we want to look at the drop in the level by 60dB in the spectrogram and are happy if we then have a few dB extra before the background noise, then it should be clear that it is difficult for us to record all information with a gentle "conversation volume".
Of course there are limits to the volume: we don't want to damage the loudspeaker or bring it into the area where it distorts. On the other hand, we may have to sit very close to the loudspeaker during the measurement and do not want to endanger our hearing. Or we have sensitive roommates, pets or neighbors. Of course, we shouldn't strain all that. Because later we have a few more tricks on how to make our 60dB waste visible, even if we don't get it completely acoustically in this first step.
Ultimately, however, no method is as simple and quick as increasing the volume. Depending on your equipment, there are several places where you can increase the level. On the one hand, directly on the (active) loudspeaker or on the amplifier or receiver. Or you can turn up the output on the audio interface or increase the level of the measurement signal in the measurement software. In the end, your measurement signal should be heard quite loudly and more than clearly differentiate itself from the ambient noise in your room.
A little tip: You do not have to be present during the measurement! If it gets too loud for you, use the delay function in REW with, for example, 20-30 seconds lead time. So you can comfortably leave the room, close the door and go for a coffee in the meantime while the measurement is running.

You are most likely to see the effect of increasing the volume in the impulse response. You actually increase the peak at the beginning of the pulse by increasing the volume. REW, however, usefully normalizes the first pulse to 0dB, so it looks as if we are reducing the noise in the room.
If, as in my test setup, the measurement signal is hardly louder than the ambient noise, the first pulse only rises by a good 20dB from the background noise. This is not optimal even for a simple frequency response from direct sound. The noise is too high for room acoustic analysis.

I increased the level of the measurement signal in REW in 10dB steps. One can clearly see that the signal-to-noise ratio improves by exactly the same amount.

With an increase of 30dB to an estimated 85dB SPL (a value that I can tolerate comfortably without having to keep my ears shut), the impulse protrudes a good 50dB from the background noise despite my artificial background noise. This is sometimes useful for first room acoustics findings, but for a good waterfall diagram and spectogram we should use a few more tweaks!
2. Increase input gain
One point that should follow immediately after the acoustic volume of the measurement signal has been set is the setting of the input gain on the audio interface. The quality of today's interfaces is usually very good that this point is hardly noticeable. But of course there is an upper and lower limit here too. If the input overdrives, the measurement software would usually complain and ask you to lower the input level. Because an overdriven signal falsifies all curves during further evaluation.
If the level is too low, the software usually does not report this as an error. And since the dynamic range of your audio interface is probably greater than the dynamics between your loudspeaker and your ambient noise, there is usually little to worry about. Nevertheless, especially with room acoustic measurements, you should increase the input level so that the headroom is only 10-20dB. It is not necessary and does not make sense that you can get up to 5dB to the overload limit. Because if you later move your microphone or speaker to compare different positions, the level can fluctuate by a few dB. And you want to keep the input level the same for reproducibility for all measurements rather than change it between measurements. The headroom should not be more than 20dB, because otherwise your room response may be lost in the noise of your interface.
3. Wait for the right time
Many of the noises that we have to deal with during measurements every day are not necessarily static. Sometimes a truck drives past, or a craftsman drills a hole in the wall in the neighboring house. Especially in the live sound area, we are rarely alone in the room when measuring, but have to somehow arrange with the other colleagues from stage construction, lighting and video.
It is important to develop a certain instinct here when the time is right to start a measurement. If you already know that you want to try different positions and you prefer to get an hour or more of silence, then it makes sense to choose the right time of day. When measuring sound reinforcement systems, I usually try to be the only one working during the lunch break, because this is by far the best and most productive time for measurements. I then take my own break e.g. at a time when the cleaning staff is just coming through the room with their vacuum cleaners.
I can still remember when we used to measure and record music in churches during our studies. After the first appointment it was clear to us that we can only start there in the evening.
During the day, the ambient noise from traffic noise in many places is decidedly higher than in the evening or at night. On the other hand, you naturally have to consider whether your neighbors might feel disturbed by nighttime measurements! So it depends very much on your own circumstances. But the right time is an important point when it comes to ambient noise.
Sometimes you can also influence the ambient noise. Air conditioning systems in large halls often generate very low-frequency noise. These are barely audible to the public in the hall, but when it comes to RT60 measurements, you can see them very clearly. Possibly. the air conditioning can be switched off for a certain time, and all your measurements are significantly better in one fell swoop.
4. Increase the length of the measurement
In medium-sized rooms, be it your living room or recording studio, the reverberation time is usually less than a second. In any case, a measurement of 2 seconds should always be sufficient for our purposes purely “in terms of content” (unless you actually want to measure in a church).
However, it still makes sense that we significantly increase the duration of the measurement. If we leave the volume of the sweep or pink noise the same, but play this signal over a longer period of time, we can apply more sound energy to the room. We simply increase the signal-to-noise ratio of our measurement, i.e. the distance of our peak in the impulse response to the constant background noise. And it doesn't matter whether the noise is acoustic or technical.
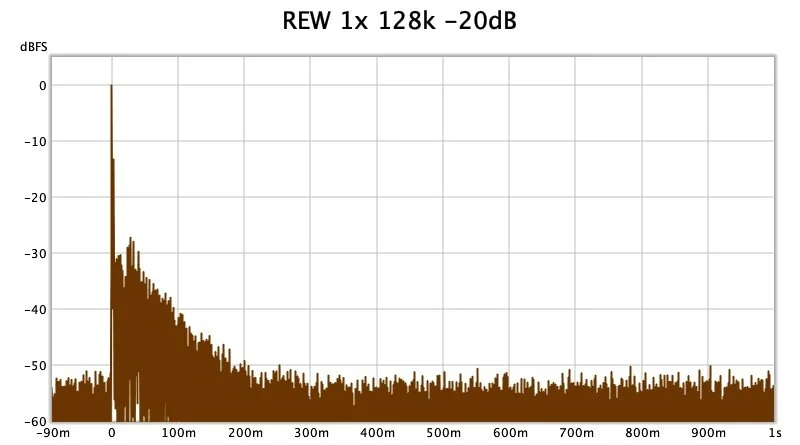
With every doubling of the measurement duration, we achieve an improvement of 3dB. Usually this parameter is set in the measurement software by the number of samples. Depending on the sampling rate, a length of 128k corresponds to about 2.9 seconds (at 44.1kHz) or 2.7 seconds (at 48kHz).

In critical environments there is no reason why we should not choose a length of e.g. 1M with a measuring time of around 21 seconds.
If you are happy with a few additional dB signal-to-noise ratio and a few seconds, then you can increase this parameter as you like. 1M is 2 to the 3 times the length of 128, which means we get 3 times 3dB = 9dB better signal-to-noise ratio.
Each further step naturally costs us a disproportionate amount of time because the measurement time doubles. 512k or 1M can still be coped with in the normal process without feeling delayed. For reasons of time, I never use 2M or 4M with a duration of more than one minute in the daily routine. Only for a final measurement, when all decisions have been made and you want to log the result as best as possible, in my view, the additional effort is worthwhile.
REW has a useful feature in this regard: it automatically shortens the impulse response generated to a meaningful value after the measurement. Because if you drag along the impulse response of 20 seconds and more in the software each time and use it for every calculation, this slows down the performance and increases the memory requirement. By default, REW shortens the impulse response to 1.7 seconds immediately after the measurement. If this is too short for you, this value can also be extended in the Preferences or the complete impulse response can be received.
5. More repetitions / averages
This point is based on the same principle as the previous point. Again we use more time for the measurement. This time we don't just run the measurement once, but several times. Both Smaart and REW offer a suitable option that does this fully automatically and then average all measurements. All we have to do is select the desired number of measurements (also called repetitions or averages depending on the software) and simply wait until the last run has been completed.
When combining the individual measurements, in simple words they are just added. The actual useful signal is always the same for a loudspeaker and its room response. And the addition of two coherent (in-phase) signals leads to an increase of 6dB. The noise, on the other hand, is different for each pass. And the addition of two incoherent signals only leads to an increase of 3dB. Ultimately, with every doubling of the repetitions, we get a 3 dB increase in the signal-to-noise ratio. And all we have to do is wait a little longer!
When using Smaart, the same results, regardless of whether you define a single measurement longer (as explained in point 4) or whether you perform a shorter measurement several times. My personal assessment: a single longer sweep is a little more pleasant and entertaining for me than if you had to listen to a shorter sweep four or eight times. And outsiders don't associate an alarm with a one-time sweep as quickly as with many repetitions.
Repetitions at REW are only of limited use
At REW I also always achieved an improvement of 3dB when extending the measurement according to point 4. In contrast, my experiences with repetitions are mixed. Repetitions almost always lead to the fact that the background noise that was actually constant in my experimental setup became quieter at the end of the impulse response than at the beginning. And if this applies to the background noise, then I am afraid that a useful signal such as the reverberation will be reproduced more quietly towards the end and that the impulse response is ultimately incorrect.
Secondly, not every doubling always leads to an improvement. With a length of 128k (2.7s) the signal-to-noise ratio improves up to 4 repetitions. At 8, I see no further improvement. With the longer measurements, the additional profit became less and less in my tests. With 1M, for example, I couldn't see any improvement and it is ultimately a waste of time.
I would advise you to experiment here yourself at the beginning whether using multiple repetitions actually brings an improvement in your setup.
Bonus tip for Smaart users
Even if Smaart has recently improved the room acoustics part of the software and also promises the use of sweeps (with my current version 8.4.3.2 it does not work smoothly yet), you will probably work with Pink Noise from the internal signal generator. There is an almost inaudible but mathematically very important point in the options window that significantly improves the signal-to-noise ratio:
The Drop IR Data Window option couples the length of the noise to that of the measurement. You can then hear that the noise repeats itself every 3 seconds (or whatever measurement lengths you have selected), but it brings a reduction in noise by around 9dB!
You should always activate this option to generate high-quality impulse responses!

Here are my two impulse responses with otherwise identical parameters and signals. On the left the noise level is at around -34dB, on the right with the option activated the noise floor is at only -43dB.


Bonus tip for REW
If you are currently only interested in the low frequencies, for example because you want to try out different positions for speakers or absorbers, then the frequency range for the measurement can be limited in REW.
First the bad news: if your measurement signal only reaches up to 250Hz, for example, then of course your data does not contain any information about the behavior of your speakers or your room above 250Hz. If you can cope with this limitation depending on the situation, there are several good news:
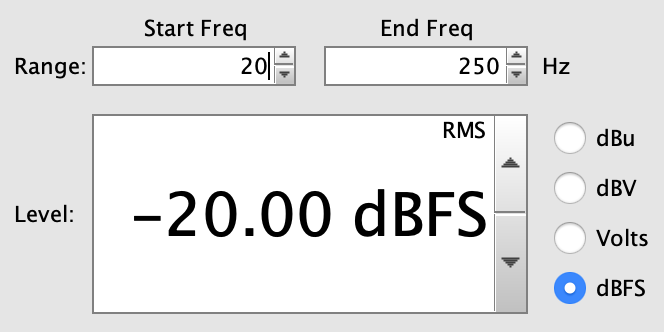
REW no longer uses the set data length and measurement duration for the entire frequency range (e.g. 20Hz to 20,000Hz), but instead extends the measurement for the restricted range (e.g. 20Hz to 250Hz) accordingly. As we saw in point 4, the longer the measurement, the better the signal-to-noise ratio. Instead of 10 octaves (20Hz to 20kHz) we have to cover less than 4 octaves. This results in more than twice the time for the lower frequency range and should lower our noise floor by more than 3dB.
But the whole thing has another practical use: we protect our ears! We don't have to listen to the possibly loud and annoying high frequencies with every measurement! The range up to 250Hz (depending on the situation you can even cut off at 120Hz) is quite unobtrusive for our hearing. And maybe we can even use this to raise the level again by several dB!
A small note about this frequency limitation: due to the lack of high frequencies, the peak in the impulse response is no longer recognizable as an outstanding peak, but is rather flattened. It is therefore no longer possible to read the signal-to-noise ratio on the basis of the impulse response, as described above. However, this partial measurement is advantageous for the waterfall diagram and the spectogram!
As always, I hope you enjoy trying it out!
Blog-article: The Big Measurement Microphone Comparison
Blog-article: How to measure room modes with REW (freeware)
Blog-article: Rock wool, glass wool, hemp - which material is best suited for absorbers?